Docxpresso incorporates «out of the box» a basic analytics tool that allow Docxpresso editors to visualize graphically the consolidated data gathered by a given template.
This tool may show particularly useful for template which main goal is to retrieve user data susceptible of a statistical analysis like, for example, user surveys.
Docxpresso analytics tool is pretty versatile because allows for the creation of specific «runs» that may be associated with a particular date range or template version.
Let us get now into the details.
Activating analytics for a template
You may access the Analytics control panel from the main template management interface:
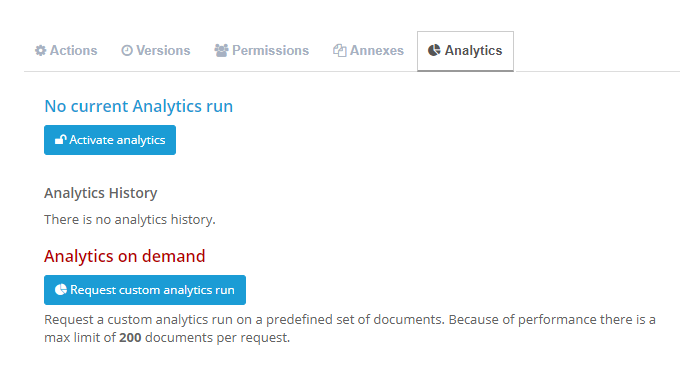
By default there is no created analytics run although you can always «analyze» on real time a batch of 200 documents (more on this below). The reason to limit the number of documents is not to block the server with very large petitions.
NOTE: this number of 200 documents may be overridden under request to the platform administrators or may be changed in the future.
In order to activate an analytics run one should simply click on the available button and the following user interface will be shown after reloading the page:
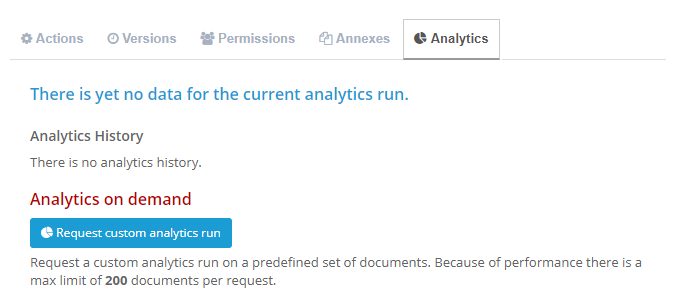
The shown message just tells you that there is no data yet but as soon as any user completes a document data will be added to that particular analytics run.
Let us now check the interface of a template where analytics have been activated and data has been «added»:
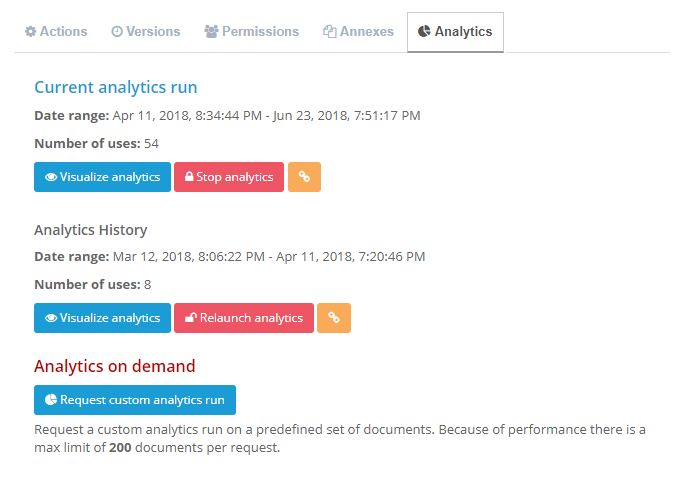
In this case we have two analytics run:
- An active one that has been collecting data from the 11 of April of 2018 and with a last update the 23 of June of the same year.
- A run that was active from the 12 of March until the 11 of April.
With an active run you may:
- Visualize the data.
- Stop the run, i.e. it will stop to gather data and a button to create a new run will be shown.
- Create a link to embed the results of that run in an external site.
With an already stopped run you may:
- Visualize the data.
- Relaunch the run, i.e. it will stop the current run if any and will continue to add data to this run.
- Create a link to embed the results of that run in an external site.
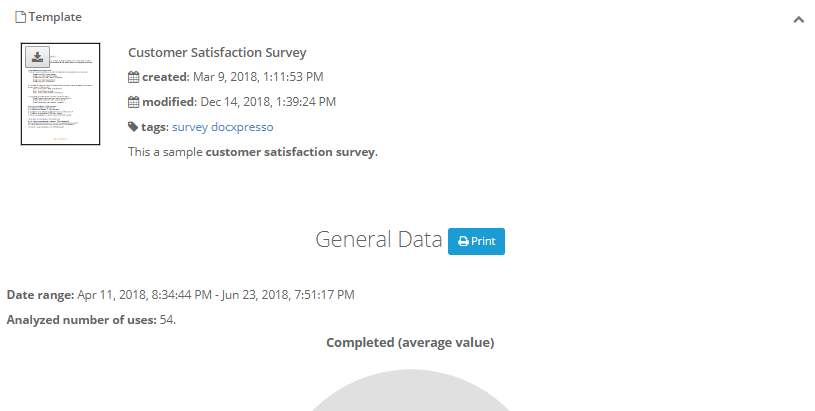
Whenever you choose to visualize the data you will be forwarded to a web interface that will include visual information about each of the variables that have a set of closed options (drop-downs, multiselects, checkboxes or radio buttons) or numerical data, for example:
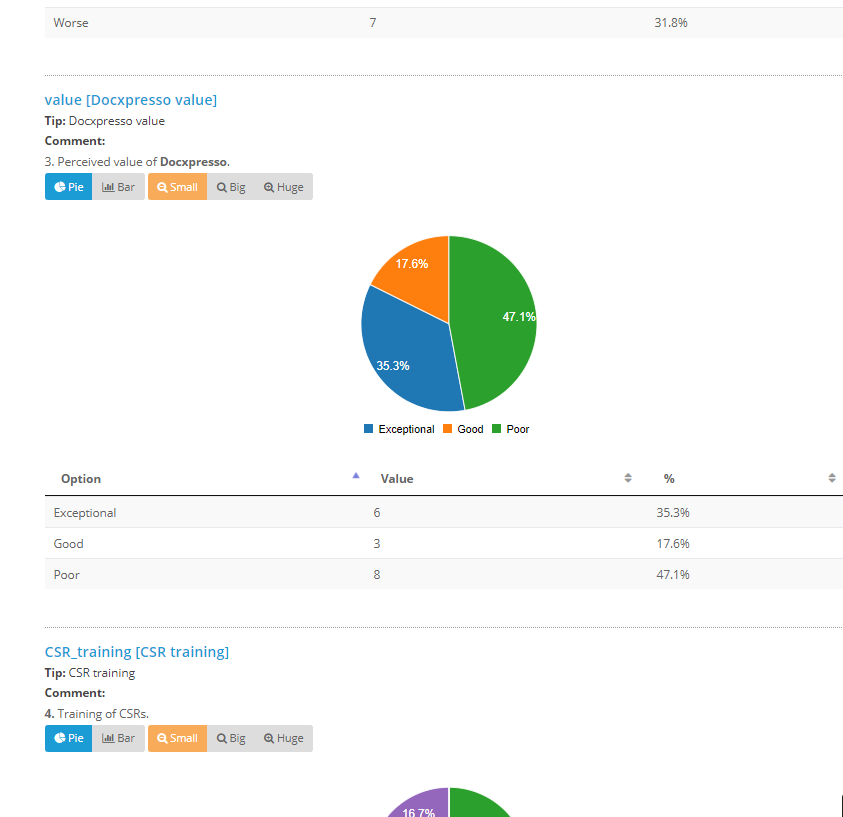
Where you can check the user input in a consolidated manner allowing you to choose the type and size of the rendered charts.
You may also print the results to PDF with the help of the print button located at the beginning of the page:
Custom analytics run
As explained before you can always analyze small batches of data without the need to define a run.
Whenever you click on the «Request custom analytics run» button you will be redirected to an interface where you can filter the documents to be analyzed:
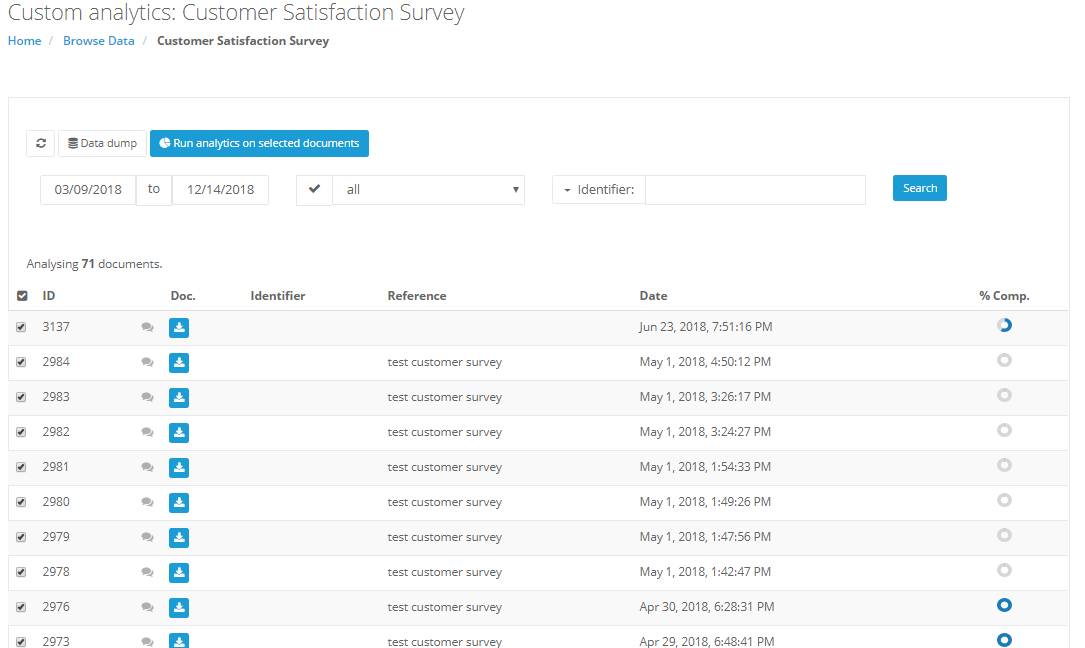
By clicking in the «Run analytics on the selected documents» button the selected documents will be parsed and represented graphically as before, although beware that there may be restrictions in the number of documents to be parsed in real time.
Creating an embedding link
By clicking on one of the available link buttons we are offered a link:
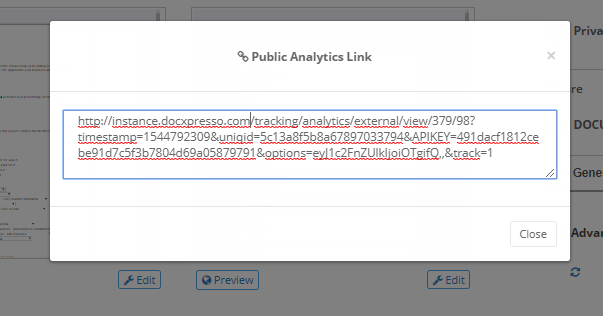
Copy it and paste it on your website or send it by email to let external users to access the associated statistical data.
